Basics
This section describes the basic usage of cesiumpy. cesiumpy is the lightweight
wrapper for Cesium.js.
This package offers limited API intended for:
- Interactive data visualization using
Jupyter Notebook
This package IS NOT intended for:
- Website development using whole functionality of Cesium.js.
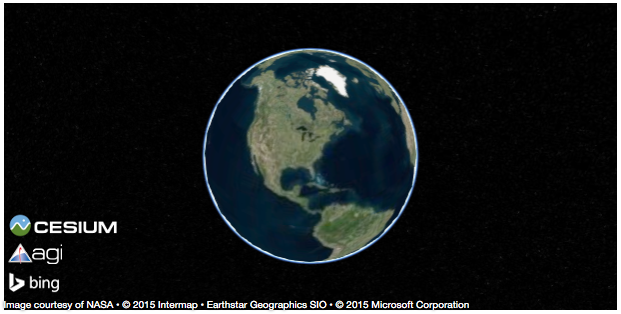
Display Cesium Widget
The easiest way to show the Cesium.js on your browser is to use CesiumWidget on Jupyter Notebook.
Because CesiumWidget has _repr_html_ method to render HTML on Jupyter Notebook,
placing variable contains CesiumWidget will output the map implemented on the output cell.
>>> import cesiumpy

>>> v = cesiumpy.CesiumWidget()
>>> v
If you do not use Jupyter Notebook, you can use .to_html method to output rendered HTML.
Save the output as a file then open with your web browser.
>>> v.to_html()
u'<script src="https://cesiumjs.org/Cesium/Build/Cesium/Cesium.js"></script>\n<link rel="stylesheet" href="http://cesiumjs.org/Cesium/Build/CesiumUnminified/Widgets/CesiumWidget/CesiumWidget.css" type="text/css">\n<div id="container-4344218320" style="width:100%; height:100%;"><div>\n<script type="text/javascript">\n  var widget = new Cesium.CesiumWidget("container-4344218320");\n</script>'
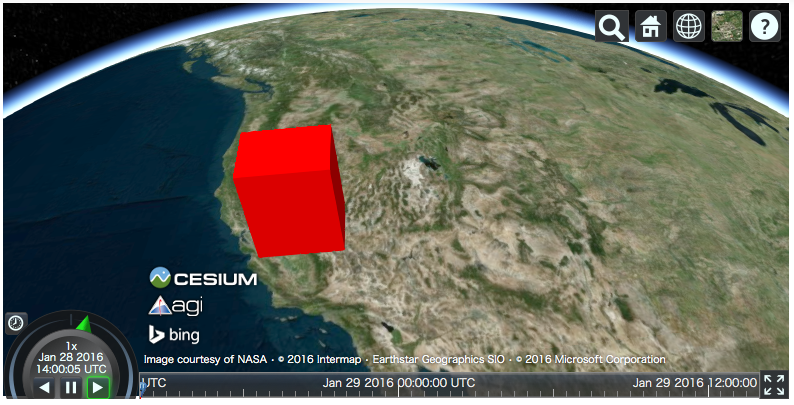
Add Entities
Cesium.js allows you to add various entities on the map. To do this, create Viewer instance and add preferable entity.
Even though Viewer also has various type of user control menus, below example disable almost of them because some of them are not displayed on Jupyter Notebook properly.
>>> v = cesiumpy.Viewer()
>>> b = cesiumpy.Box(dimensions=(40e4, 30e4, 50e4), material=cesiumpy.color.RED, position=[-120, 40, 0])
>>> v.entities.add(b)
>>> v
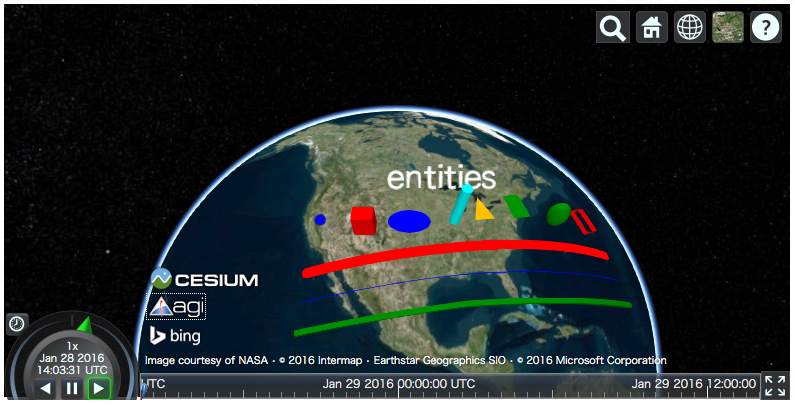
cesiumpy currently supports following entities. Refer to Entities section for more details.
PointLabelBoxEllipseCylinderPolygonRectangleEllipsoidWallCorridorPolylinePolylineVolumeBillboard
The below example draws all entities on the map.
>>> v = cesiumpy.Viewer()

>>> label = cesiumpy.Label(position=[-90, 50, 0], text='entities')
>>> v.entities.add(label)

>>> point = cesiumpy.Point(position=[-120, 40, 0], color=cesiumpy.color.BLUE)
>>> v.entities.add(point)

>>> box = cesiumpy.Box(position=[-110, 40, 0], dimensions=(40e4, 30e4, 50e4), material=cesiumpy.color.RED)
>>> v.entities.add(box)

>>> ellipse = cesiumpy.Ellipse(position=[-100, 40, 0], semiMinorAxis=25e4,
...                            semiMajorAxis=40e4, material=cesiumpy.color.BLUE)
>>> v.entities.add(ellipse)

>>> cylinder = cesiumpy.Cylinder(position=[-90, 40, 50e4], length=100e4,
...                              topRadius=10e4, bottomRadius=10e4,
...                              material=cesiumpy.color.AQUA)
>>> v.entities.add(cylinder)

>>> polygon = cesiumpy.Polygon(hierarchy=[-80, 40, -85, 40, -82.5, 45],
...                            material=cesiumpy.color.ORANGE)
>>> v.entities.add(polygon)

>>> rectangle = cesiumpy.Rectangle(coordinates=(-75, 40, -70, 45),
...                                material=cesiumpy.color.GREEN)
>>> v.entities.add(rectangle)

>>> ellipsoid = cesiumpy.Ellipsoid(position=(-60, 40, 0), radii=(20e4, 20e4, 30e4),
...                                material=cesiumpy.color.GREEN)
>>> v.entities.add(ellipsoid)

>>> wall = cesiumpy.Wall(positions=[-50, 35, -55, 35, -55, 40, -50, 40, -50, 35],
...                      maximumHeights=10e4, minimumHeights=0,
...                      material=cesiumpy.color.RED)
>>> v.entities.add(wall)

>>> corridor = cesiumpy.Corridor(positions=[-120, 30, -90, 35, -50, 30], width=2e5,
...                              material=cesiumpy.color.RED)
>>> v.entities.add(corridor)

>>> polyline = cesiumpy.Polyline(positions=[-120, 25, -90, 30, -50, 25], width=0.5, material=cesiumpy.color.BLUE)
>>> v.entities.add(polyline)

>>> polylinevolume = cesiumpy.PolylineVolume(positions=[-120, 20, -90, 25, -50, 20],
...                                          shape=[-5e4, -5e4, 5e4, -5e4, 5e4, 5e4, -5e4, 5e4],
...                                          material=cesiumpy.color.GREEN)
>>> v.entities.add(polylinevolume)
>>> v
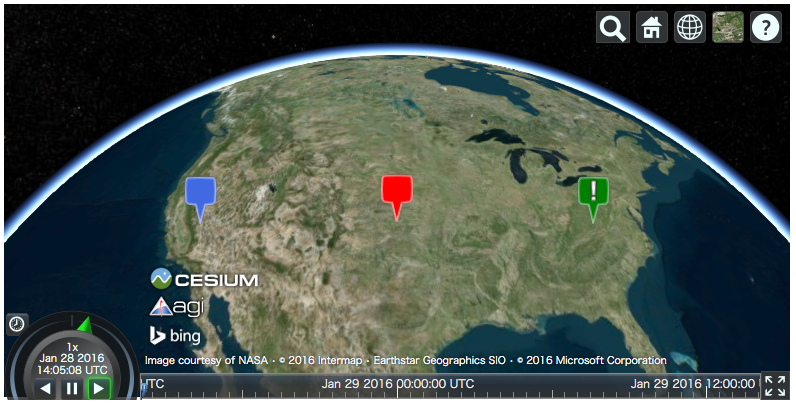
The below example draws various Pin on the map.
>>> v = cesiumpy.Viewer()
>>> pin1 = cesiumpy.Pin()
>>> bill1 = cesiumpy.Billboard(position=[-120, 40, 0], image=pin1)
>>> v.entities.add(bill1)

>>> pin2 = cesiumpy.Pin(cesiumpy.color.RED)
>>> bill2 = cesiumpy.Billboard(position=[-100, 40, 0], image=pin2)
>>> v.entities.add(bill2)

>>> pin3 = cesiumpy.Pin.fromText('!', color=cesiumpy.color.GREEN)
>>> bill3 = cesiumpy.Billboard(position=[-80, 40, 0], image=pin3)
>>> v.entities.add(bill3)
>>> v
Camera
CesiumWidget and Viewer has a camera property which allows you to
specify the location to be displayed. You can call flyTo method to specify
the location passing tuple or list.
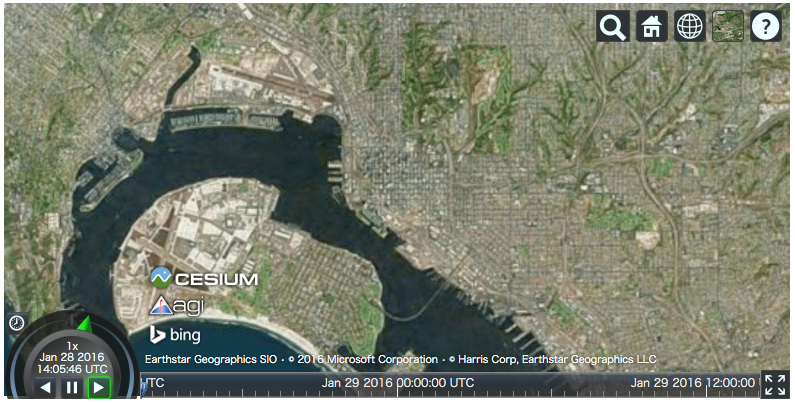
If input length is 3, it will be regarded as the point specified by (longitude, latitude, height).
>>> v = cesiumpy.Viewer()
>>> v.camera.flyTo((-117.16, 32.71, 15000))
>>> v
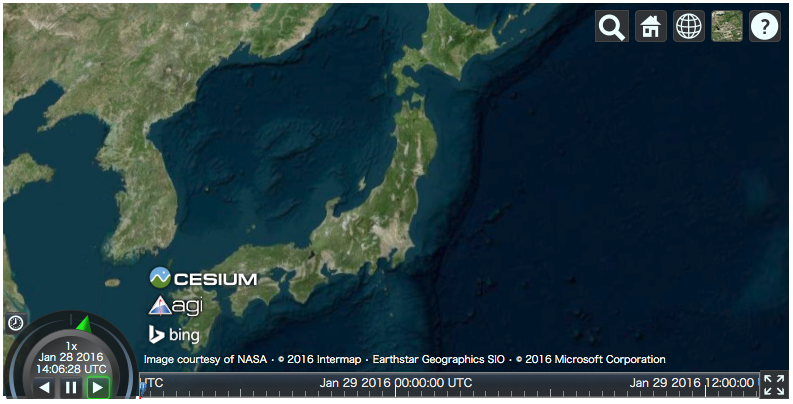
- If input length is 4, it will be regarded as the rectangle specified by (
west,south,east,north).
>>> v = cesiumpy.Viewer()
>>> v.camera.flyTo((135, 30, 145, 45))
>>> v
Add Providers
Cesium.js supports some “layers” to cover the map. Objects which provides “layers” are called as “provider”. There are 2 types of providers as below:
ImageryProvider: Provides layers with imageryTerrainProvider: Provides layers with terrain and water effects
ImageryProvider
Refer to following document for the general explanation of ImageryProvider:
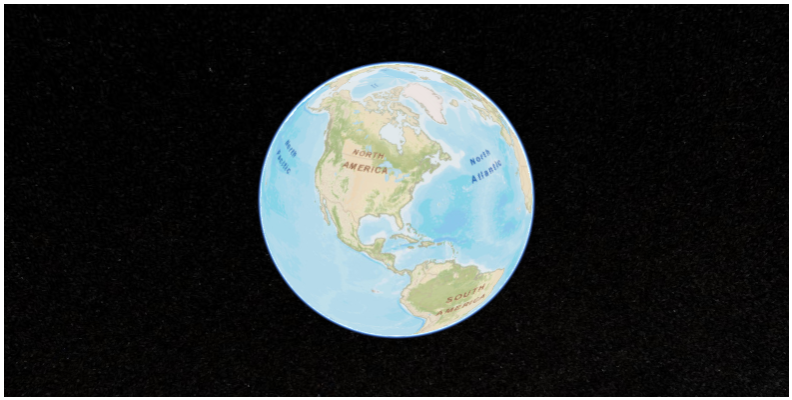
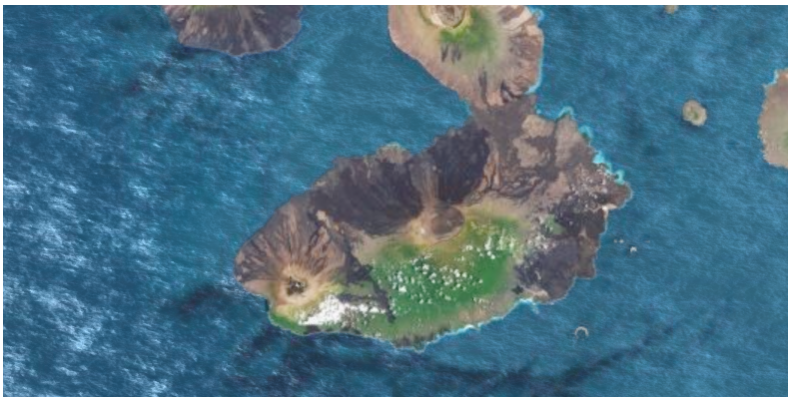
The below example outputs the map covered by the image provided by the ArcGIS MapServer, as the same as the above tutorial.
>>> url = 'http://server.arcgisonline.com/ArcGIS/rest/services/World_Street_Map/MapServer'
>>> imageryProvider = cesiumpy.ArcGisMapServerImageryProvider(url=url)

>>> v = cesiumpy.Viewer(imageryProvider=imageryProvider)
>>> v
Also you can use other providers.
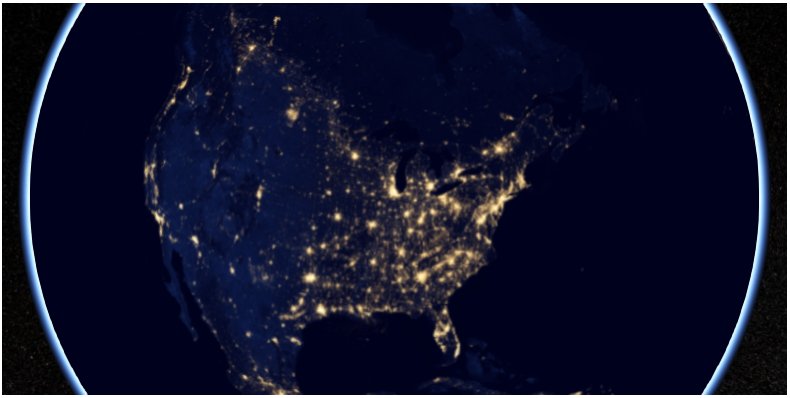
>>> url = '//cesiumjs.org/tilesets/imagery/blackmarble'
>>> credit = 'Black Marble imagery courtesy NASA Earth Observatory'
>>> imageryProvider = cesiumpy.TileMapServiceImageryProvider(url=url, maximumLevel=8, credit=credit)

>>> v = cesiumpy.Viewer(imageryProvider=imageryProvider)
>>> v
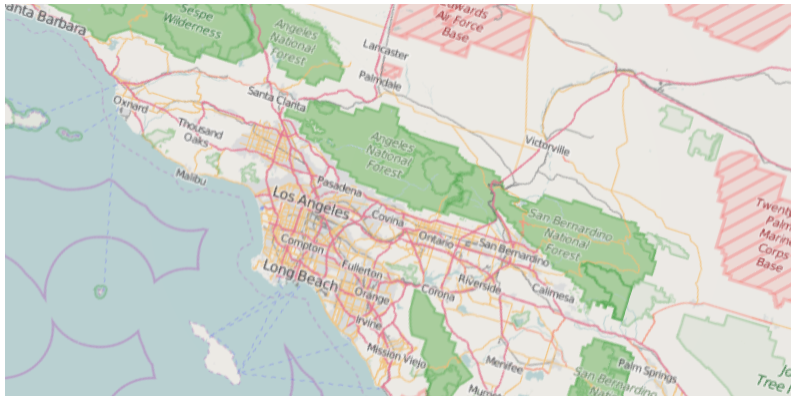
Using OpenStreetMapImageryProvider can use OpenStreetMap as imagery.
>>> imageryProvider = cesiumpy.OpenStreetMapImageryProvider()
>>> v = cesiumpy.Viewer(imageryProvider=imageryProvider)
>>> v
TerrainProvider
Refer to following document for the general explanation of TerrainProvider:
The below example outputs the map covered by the terrain provided by the Cesium Terrain Server, as the same as the above tutorial.
>>> url = '//assets.agi.com/stk-terrain/world'
>>> terrainProvider = cesiumpy.CesiumTerrainProvider(url=url)
>>> v = cesiumpy.Viewer(terrainProvider=terrainProvider)
>>> v
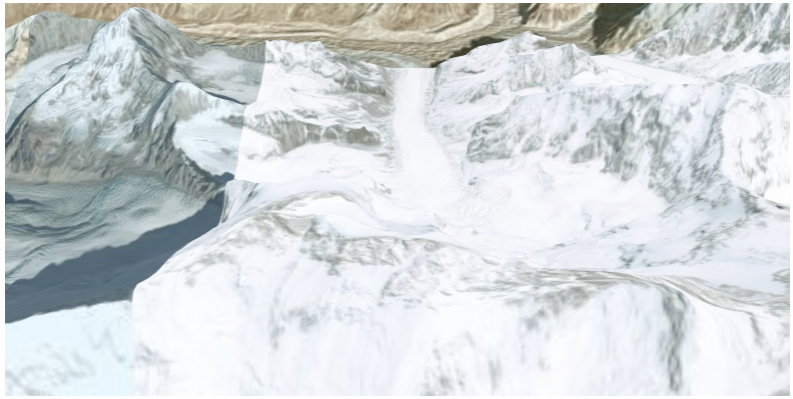
Passing requestWaterMask=True enables water effects.
>>> terrainProvider = cesiumpy.CesiumTerrainProvider(url=url, requestWaterMask=True)
>>> v = cesiumpy.Viewer(terrainProvider=terrainProvider)
>>> v
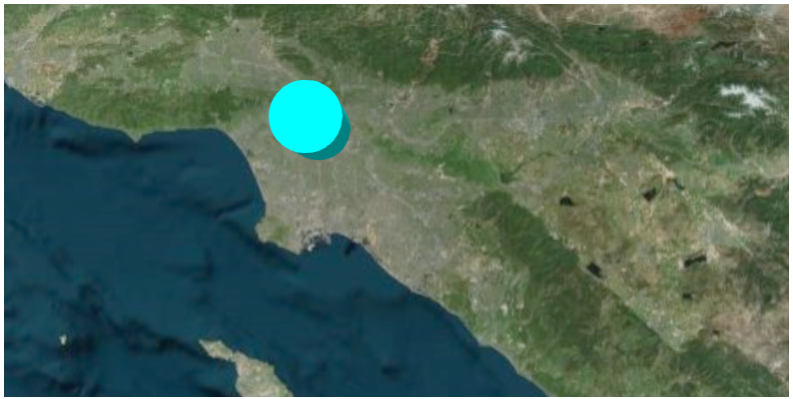
Geocoding
Cesium.js handles coordinates using numerics.
For convenience, cesiumpy automatically converts str input to coordinates
via geocoding. The geocoding function is internally provided by geopy‘s GoogleV3 geocoder.
You can use str specifying location where you can use coordinates as below.
>>> viewer = cesiumpy.Viewer()
>>> cyl = cesiumpy.Cylinder(position='Los Angeles', length=30000, topRadius=10000,
...                         bottomRadius=10000, material='AQUA')
>>> v.entities.add(cyl)
>>> v.camera.flyTo('Los Angeles')
>>> v