Read External Files
Read External Files as Data Source
Cesium.js has a DataSource class which
can draw external data as entities.
cesiumpy currently supports following DataSource.
GeoJsonDataSourceKmlDataSourceCzmlDataSource
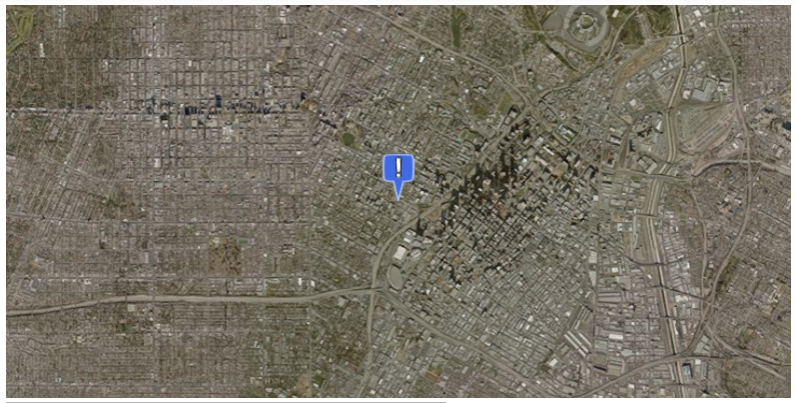
GeoJSON
Assuming we hanve following .geojson file named “example.geojson”.
{
    "type": "Point",
    "coordinates": [-118.27, 34.05 ]
}
You can create GeoJsonDataSource instannce then add to Viewer.DataSources.
markerSymbol option specifies the symbol displayed on the marker.
>>> ds = cesiumpy.GeoJsonDataSource('./example.geojson', markerSymbol='!')
>>> v = cesiumpy.Viewer()
>>> v.dataSources.add(ds)
>>> v
Or, you can use load class method to instanciate DataSource like Cesium.js.
>>> cesiumpy.GeoJsonDataSource.load('./example.geojson', markerSymbol='!')
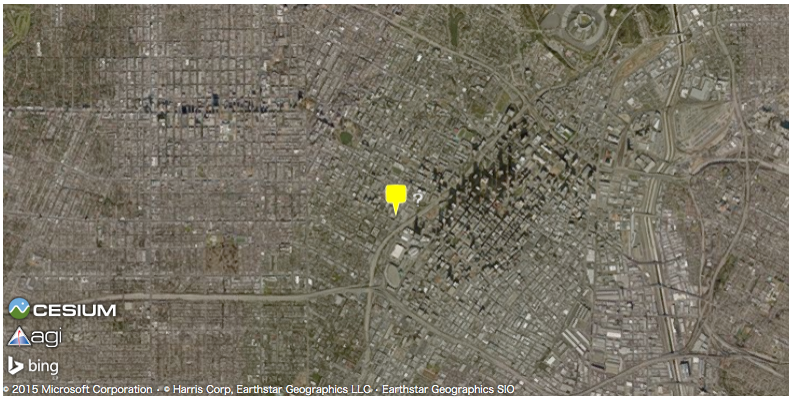
KML
You can use KmlDataSource to read .kml files. Assuming we have following content:
<?xml version="1.0" encoding="UTF-8"?>
<kml xmlns="http://www.opengis.net/kml/2.2"> <Placemark>
 <name>?</name>
 <Point>
 <coordinates>-118.27,34.05,0</coordinates>
 </Point>
 </Placemark> </kml>
>>> ds = cesiumpy.KmlDataSource('example.kml')
>>> v = cesiumpy.Viewer()
>>> v.dataSources.add(ds)
>>> v
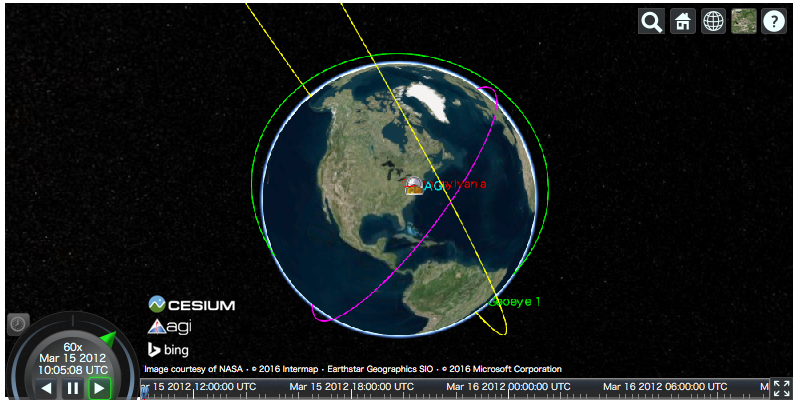
CZML
The last example is use .czml file downloaded from the
Cesium.js repository
ds = cesiumpy.CzmlDataSource('sample.czml')
v = cesiumpy.Viewer()
v.dataSources.add(ds)
v
Read External Files as Entities
cesiumpy can read following file formats using io module. The results
are automatically converted to cesiumpy entities and can be added to
map directly.
- GeoJSON
- Shapefile
GeoJSON
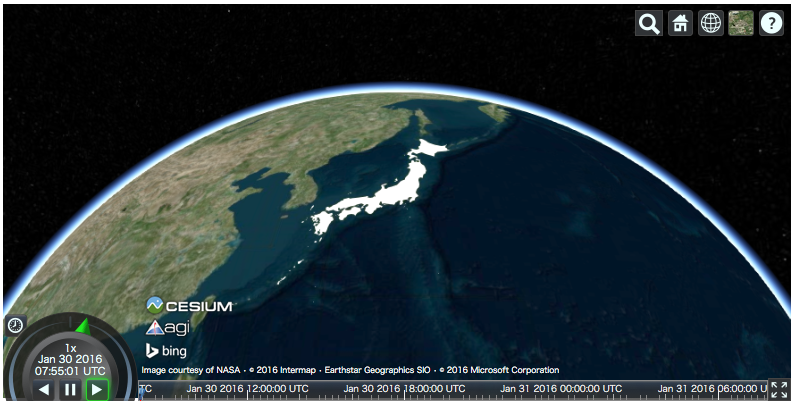
This example reads GeoJSON file of Japanese land area. cesiumpy.io.read_geojson
returns a list of cesiumpy.Polygon.
The file is provided by mledoze/countries repositry.
>>> res = cesiumpy.io.read_geojson('jpn.geo.json')
>>> type(res)
list
You can add the list as entities.
>>> viewer = cesiumpy.Viewer()
>>> viewer.entities.add(res)
>>> viewer
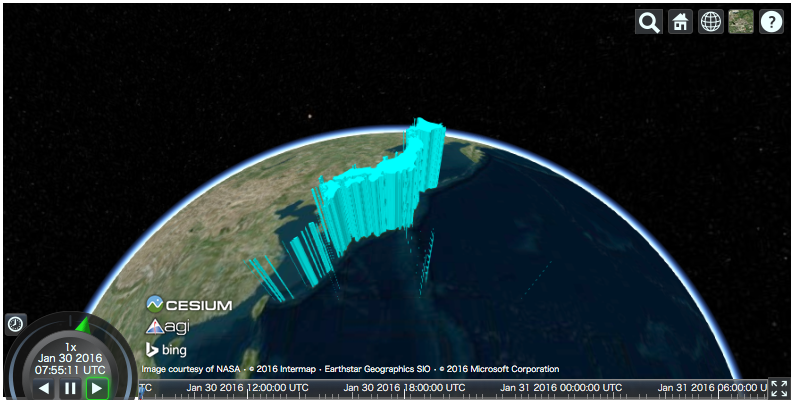
If you want to change some properties, passing keyword arguments via entities.add methods is easy. Of cource it is also OK to change properties of each entity one by one.
>>> viewer = cesiumpy.Viewer()
>>> viewer.entities.add(res, extrudedHeight=1e6, material='aqua')
>>> viewer
Shapefile
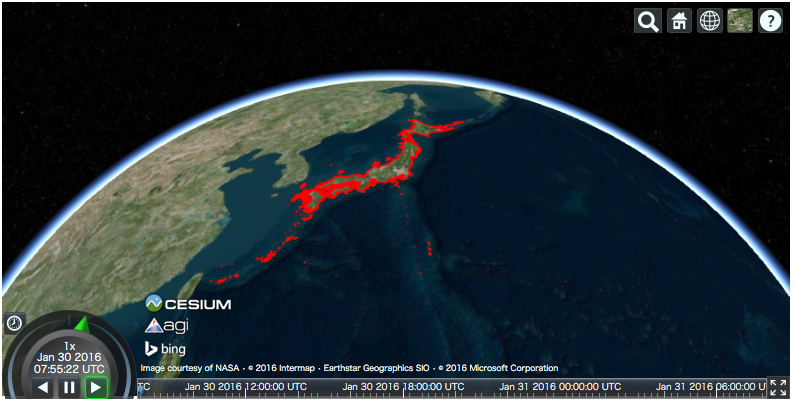
This example reads Shapefile of Japanese coastal lines. cesiumpy.io.read_shape
returns a list of cesiumpy.Polyline.
The file is provided by 地球地図日本 website.
- 出典 (Source):国土地理院ウェブサイト
>>> res = cesiumpy.io.read_shape('coastl_jpn.shp')
>>> type(res)
list
Then, you can add the result to the map.
>>> viewer = cesiumpy.Viewer()
>>> viewer.entities.add(res, material='red')
>>> viewer
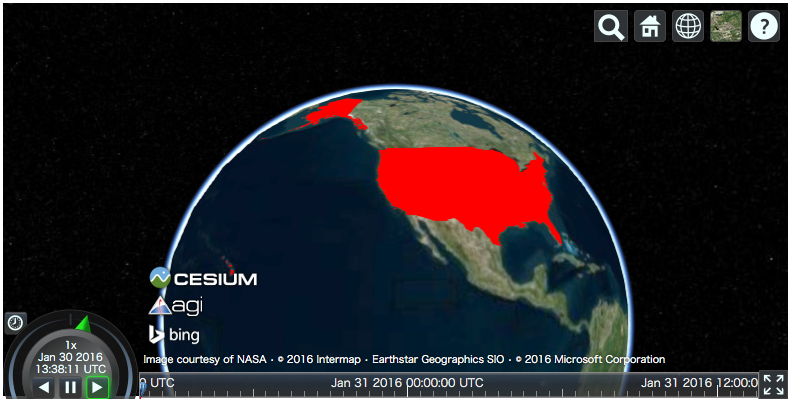
Bundled Data
cesiumpy bundles GeoJSON data provided by mledoze/countries repositry. You can load them via cesiumpy.countries.get method passing country code or its name.
Please refer to countries.json file to check available country codes (“cca2” or “cca3”) and names (“official name”).
>>> usa = cesiumpy.countries.get('USA')
>>> viewer = cesiumpy.Viewer()
>>> viewer.entities.add(usa, material='red')
>>> viewer
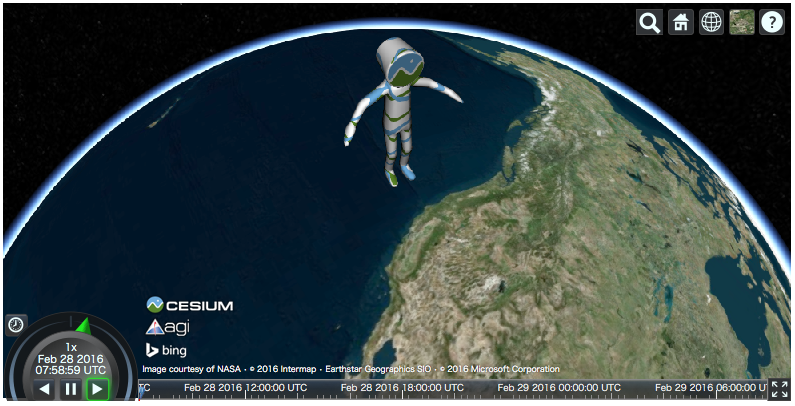
Read 3D Models
Cesium.js can handle 3D Model on the map.
For Cesium.js functionality, please refer to 3D Model Tutorial.
cesiumpy allows to put 3D Model using cesiumpy.Model instance. Following
example shows to draw Cesium Man used in the above tutorial.
>>> m = cesiumpy.Model(url='data/Cesium_Man.gltf',
...                    modelMatrix=(-130, 40, 0.0), scale=1000000)
>>> m
Model("data/Cesium_Man.gltf")

>>> viewer = cesiumpy.Viewer()
>>> viewer.scene.primitives.add(m)
>>> viewer